David Bartel
Real Estate Broker
(651) 777-0000
  • Email
  • Facebook
  • LinkedIn
  • Home
  • Search
    • Search All Listings
    • Map Search
    • New Listing Notifications
    • User Login
  • Sellers
    • Sellers Overview
    • Home Selling Process
    • FREE Home Seller’s Guide
    • What’s My Home Worth
    • Preparing Your Home For Sale
    • Cost of Selling Your Home
    • Seller’s Consultation
    • Satisfaction Guarantee
  • Buyers
    • Buyers Overview
    • Buyer Search Criteria Form
    • Home Buying Process
    • FREE Home Buyer’s Guide
    • 5 Home Buyer Tips
    • Mortgage Pre-Approval Process
    • Down Payment Resources (DPR)
    • Home Inspection
    • Title and Closing Services
    • Satisfaction Guarantee
  • Services
    • Residential – Sellers
    • Residential – Buyers
    • Investment Real Estate
    • REO Disposition
    • Consulting
    • Expert Witness Testimony
    • Property Management
  • Resources
    • Free Home Evaluation
    • Current Community Market Info
    • Community Information
    • Professional Service Partners
    • Financial Calculator
    • Down Payment Resources (DPR)
    • Blog
  • Testimonials
  • About
    • About David
    • David’s Team
    • Real VALUE Real Estate Services
    • Written Satisfaction Guarantee
    • Mission Statement
  • Contact
Home > Market Statistics: Week Ending November 3rd, 2018

Market Statistics: Week Ending November 3rd, 2018

November 19, 2018 by David Bartel Leave a Comment

Real Estate Market Graph

According to Freddie Mac, the 30-year fixed rate is at its highest average in seven years, reaching 4.94 percent. Last year at this time, the average rate was 3.90 percent. The higher rates are causing a slowdown in home price growth in some markets, but not all markets yet. Keeping a positive perspective, average rates were 5.97 percent ten years ago at this time, 6.78 percent 20 years ago and 10.39 percent 30 years ago. For maximum comparative impact, consider the 17.21 percent average rate of November 1981.

In the Twin Cities region, for the week ending November 3:
• New Listings increased 9.7% to 1,115
• Pending Sales decreased 16.5% to 943
• Inventory decreased 1.1% to 12,095

For the month of September:
• Median Sales Price increased 6.1% to $262,000
• Days on Market decreased 16.0% to 42
• Percent of Original List Price Received increased 0.3% to 98.4%
• Months Supply of Homes For Sale remained flat at 2.6
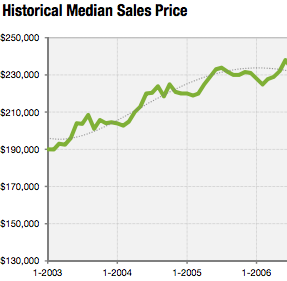
Click the graphic to the right for a full Twin Cities Real Estate report!

Filed Under: Market Reports, Real Estate News Tagged With: Market Info, Market Information, Market Statistics, Real Estate Statistics

Leave a Reply Cancel reply

Your email address will not be published. Required fields are marked *

New Listing Notifications
What's My
Home Worth

Categories

  • Coming Soon
  • Community News
  • Cost Vs. Value
  • Home Designs
  • Just Listed
  • Just Sold
  • Kitchen Redesign
  • Market Reports
  • Open Houses
  • Outdoor Living
  • Patio
  • Pre-Listing
  • Real Estate News
  • Real Estate Tips and Tricks
  • The Home Selling Process
  • Uncategorized

Search Listings

$
$

David Bartel

Real Estate Broker
Meet David
  • Email
  • Facebook
  • LinkedIn
Contact David
(651) 777-0000
David@DavidBartel.com

Transition Properties Inc.

3555 Willow Lake Blvd Suite 100
Vadnais Heights, MN 55110

sitemap   •   admin   •   ©2019 All Rights Reserved  •  Real Estate Website Design by IDXCentral.com